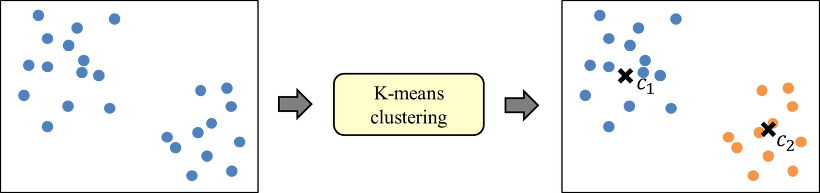
K 평균 클러스터링
- 주어진 데이터를 k개의 클러스터(군집)로 묶는 알고리즘으로, 각 클러스터의 중심과 데이터들간의 평균 거리를 최소화하는 방식
- 군집이란 비슷한 특성을 지닌 데이터들을 모아놓은 그룹이다.
- 군집화는 이러한 데이터를 군집으로 묶는 것.
- 비지도학습의 일종
K mean Clustering 알고리즘
- 데이터를 입력받아 이를 소수의 그룹으로 묶는 알고리즘
- 비지도 학습(label이 없는 데이터)
- loss_function:
K mean Clustering 알고리즘 원리 참조
[머신러닝] K-평균(K-Means) 알고리즘
머신러닝 비지도학습에 속하는 K-means 알고리즘은 K개의 군집(Cluster)로 묶는(Clusting) 알고리즘이다.
velog.io
K Mean Clustering 구현
import numpy as np
import matplotlib.pyplot as plt
def kmean_clustering(X,C,iteration):
    for _ in range(iteration):
        r_ = [] # C와 X간의 거리 리스트 : return_shape:(C개수,샘플 개수)
        for c in C.transpose(1,0):
            r_.append(np.sqrt(np.sum((X.transpose(1,0) - c)**2,axis=1)))

        r_arg = np.argmin(np.array(r_),axis=0) #C와 X중 거리가 작은 인덱스 리스트

        r = []
        for i in range(C.shape[1]):
            r.append([])
            for _ in range(C.shape[0]):
                r[i].append([])

        r_x = np.zeros(C.shape[1]) # 특징1
        r_y = np.zeros(C.shape[1]) # 특징2
        r_count = np.zeros(C.shape[1])

        for i in range(len(r_arg)):
            for j in range(X.shape[0]):
                r[r_arg[i]][j].append(X[j,i])

        for i in range(np.shape(r)[0]):
            for j in range(np.shape(r)[1]):
                r[i][j] = np.mean(r[i][j])
        r = np.array(r)
        C = r.transpose(1,0)
        C = C.astype('float32')
    return C
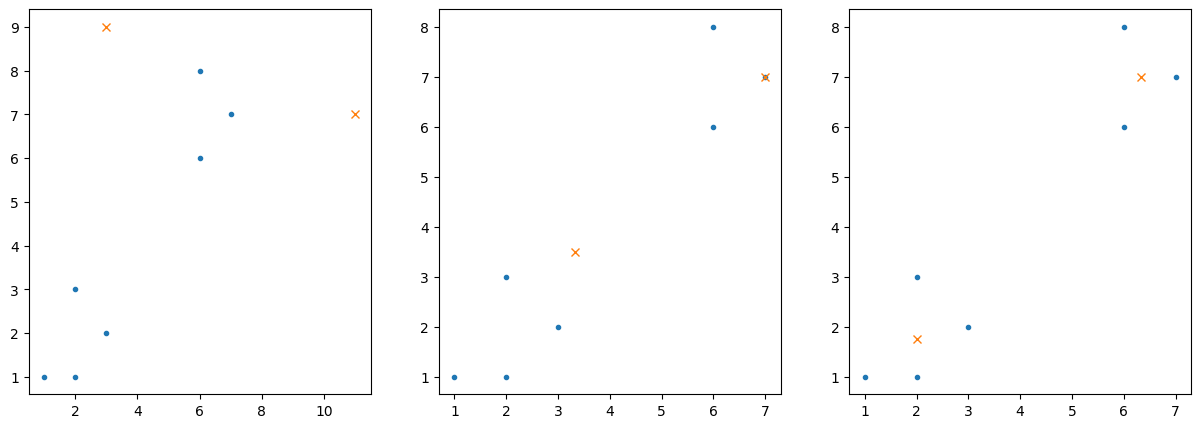
2차원 데이터 클러스터링
In [17]:
# default
x = np.array([[1,6,7,3,6,2,2]])
y = np.array([[1,6,7,2,8,1,3]])

c_x = np.array([[11.0,3.0]])
c_y = np.array([[7.0,9.0]]) # k클러스터 개수
In [18]:
X = np.concatenate((x,y),axis=0)
C = np.concatenate((c_x,c_y))
In [19]:
# visualization
fig = plt.figure(figsize=(15,5))

for i in range(3):
    ax = fig.add_subplot(1,3,i+1)
    ax.plot(X[0,:],X[1,:],'.')
    ax.plot(C[0,:],C[1,:],'x')

    C = kmean_clustering(X,C,1)
plt.show()
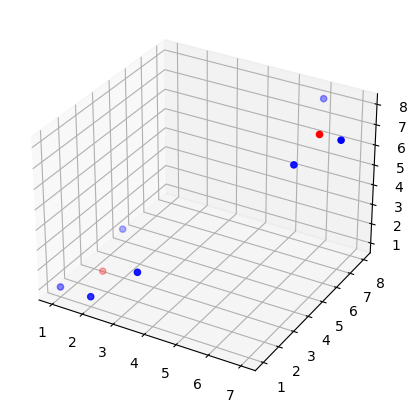
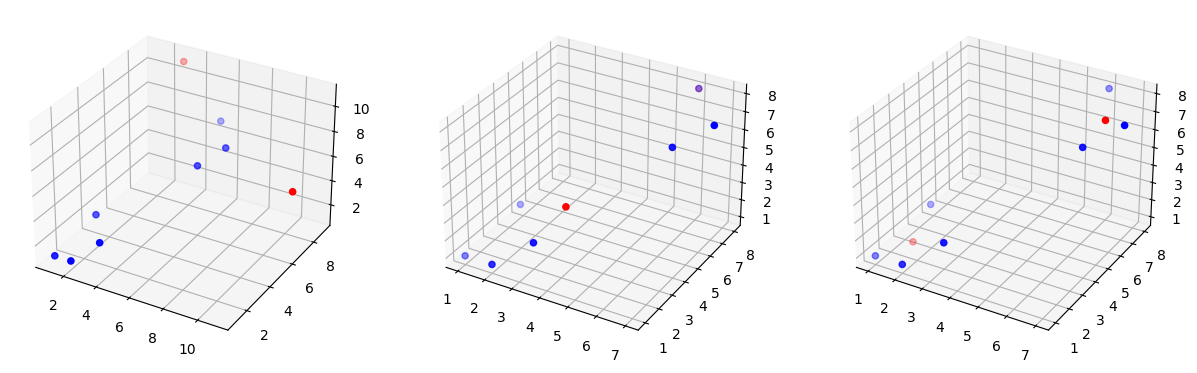
3차원 데이터 클러스터링
In [20]:
# default
x = np.array([[1,6,7,3,6,2,2]])
y = np.array([[1,6,7,2,8,1,3]])
z = np.array([[1,6,7,2,8,1,3]])

c_x = np.array([[11.0,3.0]])
c_y = np.array([[7.0,9.0]]) # k클러스터 개수
c_z = np.array([[5.0,11.0]])
In [21]:
X = np.concatenate((x,y,z),axis=0)
C = np.concatenate((c_x,c_y,c_z))
In [ ]:
C = kmean_clustering(X,C,5)
In [22]:
# visualization
fig = plt.figure(figsize=(15,5))

for i in range(3):
    ax = fig.add_subplot(1,3,1+i, projection='3d')
    ax.scatter(X[0,:],X[1,:],X[2,:],color='b')
    ax.scatter(C[0,:],C[1,:],C[2,:],color='r')

    C = kmean_clustering(X,C,1)
plt.show()
sklearn 라이브러리로 클러스터링 구현
In [23]:
from sklearn.cluster import KMeans
In [32]:
model = KMeans(n_clusters=2)
In [36]:
k_means = model.fit(X.transpose(1,0))
In [37]:
k_means = k_means.cluster_centers_
In [41]:
k_means = k_means.transpose(1,0)
In [44]:
fig = plt.figure(figsize=(15,5))
ax = fig.add_subplot(1,1,1, projection='3d')
ax.scatter(X[0,:],X[1,:],X[2,:],color='b')
ax.scatter(k_means[0,:],k_means[1,:],k_means[2,:],color='r')
plt.show()